



NFPA’s Econ and Market Indicators (EMI) report pulls together data from multiple sources to provide the latest trends for:
- Customer Markets (U.S. Census Bureau)
- Economic Indicators (U.S. Census Bureau)
- Industrial Production (Federal Reserve)
- Capacity Utilization (Federal Reserve)
- Producer Price Index (Bureau of Labor Statistics)
Members can view individual series and apply different calculations such as moving averages and rates of change. Members can also compare rates of change between markets. Tables can be sorted by values for quick looks at growing and declining markets.
Some highlights from the report include:
-
Continual Growth in the Semiconductor Marke
-
The producer price index (PPI) for Semiconductor and Other Electronic Component Manufacturing is up 26.7% Y/Y. The higher wholesale pricing has not slowed the industry down much as the industrial production index is up 12.4% Y/Y. The 3/12 and 12/12 also show above 12% growth rates.
-
The capacity utilization for Computers, Communications Equipment, and Semiconductors is down -1% M/M and -1.8% Y/Y. This signals that there has been expansions in place to increase capacity for the market.
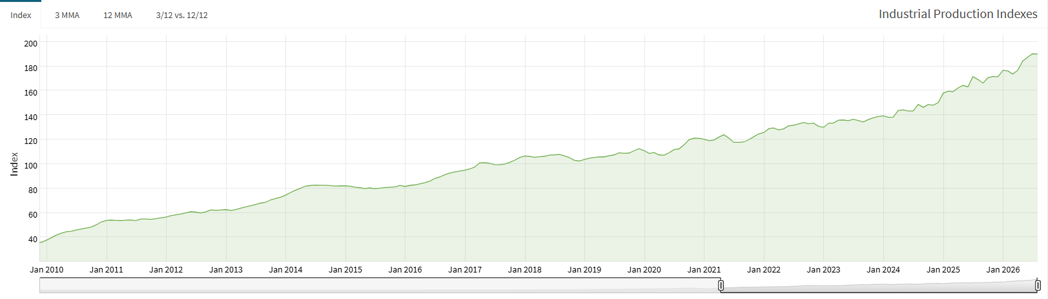
Semiconductor and Other Electrical Components IPI: Index, 11/2009 – 8/2026 - Growth in the Vehicle Market
- Automobile, Light Truck, and Utility Vehicle Shipments is up 21.3% M/M with a value of $37,193 million for August 2026. While it is a cyclical market, shipment growth is occurring on the long trend too. Shipments are up 4.6% Y/Y and the 12/12 is at 9.5%.
- The industrial production index also jumped this month, showing 22.6% M/M. While down from August of 2025, a -3.8% Y/Y, the 12/12 is at 1.2% showing an overall stability in production.
-
The EMI report can be accessed at this link: https://www.nfpa.com/econ-market-indicators. An excel file with all the raw data is also available to download for internal analysis.
If you have any questions about interpreting or using the data in these reports, please contact Richard Zarling at rzarling@nfpa.com.