

NFPA’s Econ and Market Indicators (EMI) report pulls together monthly data from multiple sources to provide the latest trends for:
- Customer Markets (U.S. Census Bureau)
- Economic Indicators (U.S. Census Bureau)
- Industrial Production (Federal Reserve)
- Capacity Utilization (Federal Reserve)
- Producer Price Index (Bureau of Labor Statistics)
Members can view individual series and apply different calculations such as moving averages and rates of change.
Members can also compare rates of change between markets. Tables can be sorted by values for quick looks at growing and declining markets.
Some highlights from a handful of the report's sections include:
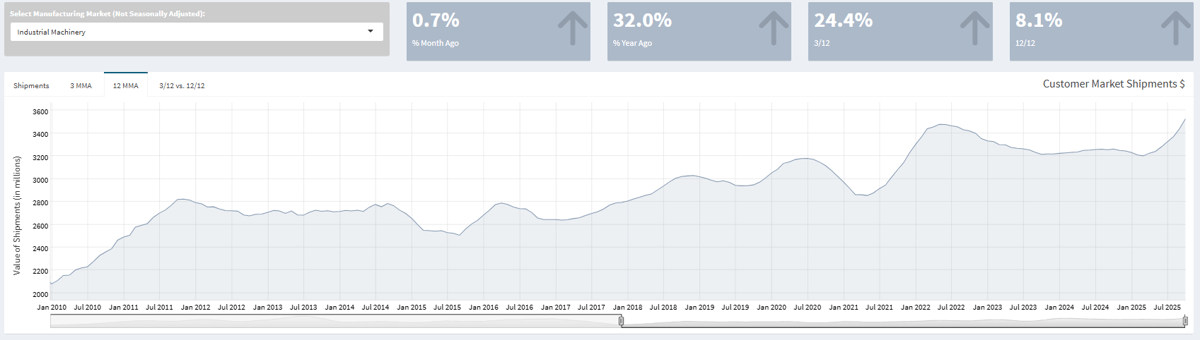
- M3 Shipment – Manufacturer's Value of Shipments
- Industrial machinery manufacturing shipments in October 2025 were 32% higher than in November 2024, reflecting a continued period of elevated activity. The 12/12 rate of change has remained positive and has shown consistent strengthening since June 2025, indicating sustained upward momentum.
- Industrial Production
- The total U.S. industrial production index for December 2025 increased 0.6% compared with November 2025 and rose 2.2% year over year. Both the 3/12 and 12/12 trends continued to move upward toward the end of 2025, suggesting ongoing improvement in overall industrial activity.
- Capacity Utilization
- Capacity utilization index for aerospace and miscellaneous transportation equipment increased steadily throughout 2025. In December 2025, utilization levels were 15.3% higher than one year earlier, supported by a 3/12 percent change of 20.5% and a 12/12 percent change of 7.8%, indicating strengthening in both short and long term trends.
- Producer Price Index
- The Producer Price Index for fluid power equipment rose 15% year over year in November 2025. Both the 3/12 percent change (14.8%) and 12/12 percent change (7.8%) point to a consistently positive pricing environment for this category.
The EMI report can be accessed at this link: https://www.nfpa.com/econ-market-indicators. An excel file with all the raw data is also available to download for internal analysis.
------------------------------------------------------------------------------
Track monthly imports and exports of fluid power by-product and by-country with the interactive U.S. Foreign Trade for Fluid Power Products Dashboard. Data is sourced from the USITC and filtered for fluid power products. Data has been updated through October 2025. Below is a brief preview of insights available in the full report linked below:
The month with the highest dollar volume of imports so far in 2025 was July at $1,036,300,867, while the lowest was February at $879,545,390. By comparison, in 2024, the highest month for imports was April at $1,047,486,918, and the lowest was September at $916,155,094. Total U.S. fluid power imports for January–October 2025 amount to $31,885,951, representing a –0.33% year‑to‑date change. The table below highlights the top five imported fluid power goods for 2024 and 2025:
2024 |
2025 |
||
|
Product |
$ Imports to US |
Product |
$ Imports to US |
|
Hydraulic Actuators, Linear |
$1,483,468,923 |
Hydraulic Pumps, Reciprocating |
$1,381,551,523 |
|
Hydraulic Valves |
$1,264,250,032 |
Hydraulic Actuators, Linear |
$1,342,585,688 |
|
Hydraulic Pumps, Reciprocating |
$1,192,693,618 |
Hydraulic Valves |
$1,296,679,790 |
|
Parts of Actuators and Motors |
$991,169,921 |
Parts of Actuators and Motors |
$1,002,174,282 |
|
Hydraulic Pumps, Rotary |
$838,291,605 |
Hydraulic Pumps, Rotary |
$802,453,993 |
Access the full report here: https://www.nfpa.com/international-fluid-power
Check out international trade data and much more in the Stats Dashboard: https://www.nfpa.com/statsdashboard
If you have any questions about interpreting or using the data in these reports, please contact Cecilia Bart at cbart@nfpa.com.