



NFPA’s Econ and Market Indicators (EMI) report pulls together data from multiple sources to provide the latest trends for:
- Customer Markets (U.S. Census Bureau)
- Economic Indicators (U.S. Census Bureau)
- Industrial Production (Federal Reserve)
- Capacity Utilization (Federal Reserve)
- Producer Price Index (Bureau of Labor Statistics)
Members can view individual series and apply different calculations such as moving averages and rates of change. Members can also compare rates of change between markets. Tables can be sorted by values for quick looks at growing and declining markets.
Some highlights from the report include:
-
Petroleum Production Stable Despite High Prices
-
The PPI Y/Y% change for Petroleum and Coal Products: Total is 76.71% and the change for Petroleum Refineries is 84.03%. The higher prices are caused by various factors in the global economy with the leading one being the closure of the Strait of Hormuz.
-
Despite these higher prices, industrial production has been little changed for both categories. Petroleum Refineries show a 0.3% M/M and a 2.0% Y/Y change and Petroleum and Coal Products are at 0.7% M/M and -0.9% Y/Y. Capacity Utilization for Petroleum and Coal Products is also down 3.0% Y/Y. This all means that higher prices have had little impact on current output.
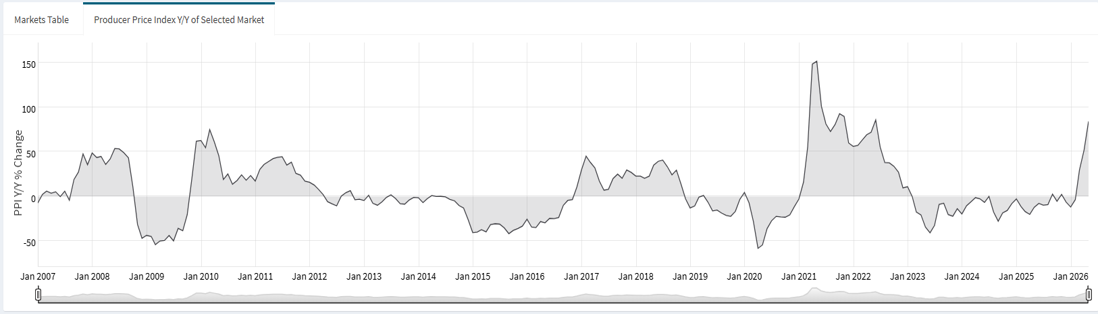
PPI Y/Y% Change: Petroleum Refineries, 1/2007 – 5/2026 - Shipment Cycles in Farm Machinery
- Farm Machinery and Equipment faces a harsh M/M with a 16.0% decrease. This decrease highlights the cyclical nature of the category’s shipments, which usually decrease around this time. The better comparison would be the 12/12 or the Y/Y which are both -7.6%. This shows that there is a larger decrease in shipments, but they are better adjusted for the cyclical nature.
- Industrial production for Farm Machinery and Equipment is down 1.5% M/M, but up 8.7% Y/Y and up 4.9% 12/12. Overall output is increasing despite shipment values decreasing over the same period.
-
The EMI report can be accessed at this link: https://www.nfpa.com/econ-market-indicators. An excel file with all the raw data is also available to download for internal analysis.
If you have any questions about interpreting or using the data in these reports, please contact Richard Zarling at rzarling@nfpa.com.