

NFPA’s Econ and Market Indicators (EMI) report pulls together data from multiple sources to provide the latest trends for:
- Customer Markets (U.S. Census Bureau)
- Economic Indicators (U.S. Census Bureau)
- Industrial Production (Federal Reserve)
- Capacity Utilization (Federal Reserve)
- Producer Price Index (Bureau of Labor Statistics)
Members can view individual series and apply different calculations such as moving averages and rates of change.
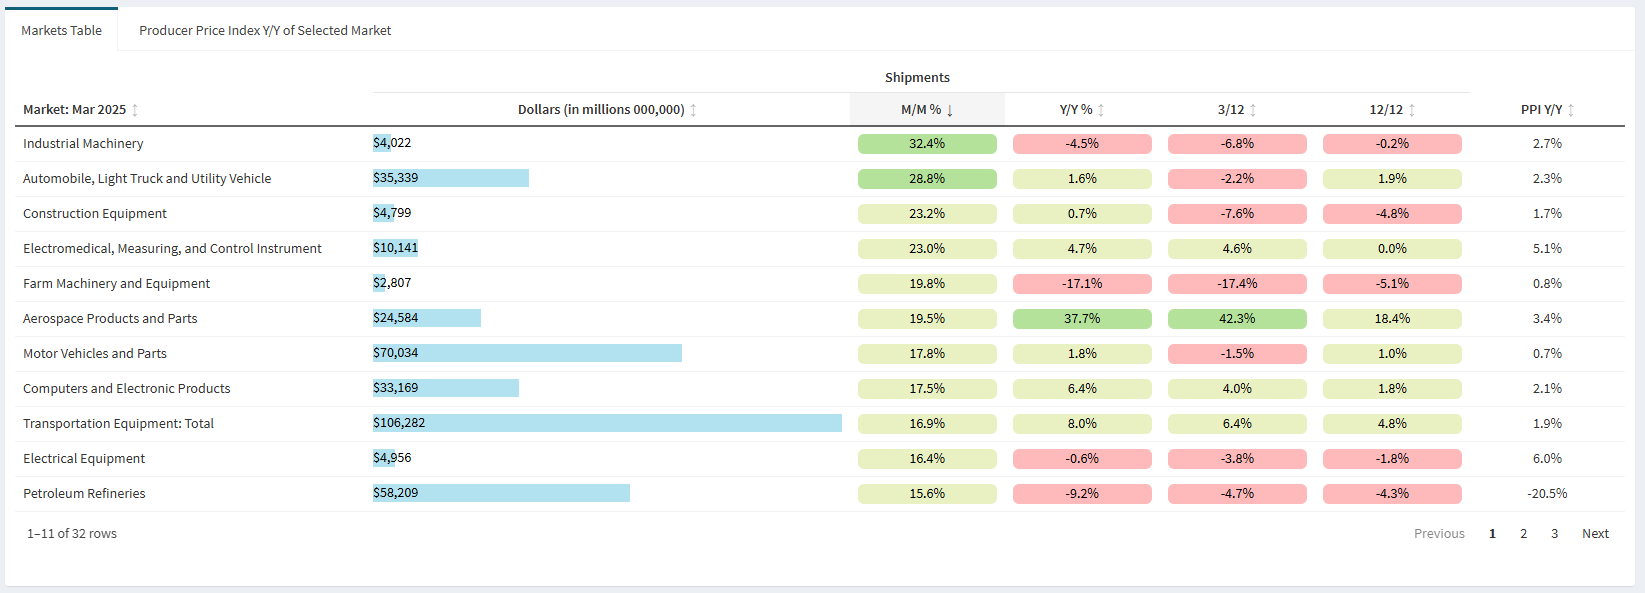
Members can also compare rates of change between markets. Tables can be sorted by values for quick looks at growing and declining markets.
Some highlights from the report include:
- Construction
- March construction equipment shipments were up 23.2% m/m, and 0.7% y/y from March 2024. Additionally, Total Construction Spending on manufacturing in the US’s growth rate has plateaued into 2025. Construction spending in March 2025 was 3.7% above the March 2024 level; however, its 3/12 and 12/12 rates of change have continued their descent into 2025.
- Pharmaceutical
- Pharmaceutical and medicine manufacturing shipments continue to trend upward with March shipments being up 11.7% m/m and 8.5% y/y. Chemical product manufacturing shipments are also trending positively at 14.4% m/m.
- Farm Machinery and Equipment
- Farm machinery and equipment industrial production shipments in March were 19.8% above February levels, but -17.1% y/y. The 3/12 and 12/12 rates of change for this category have been trending downwards so far in 2025.
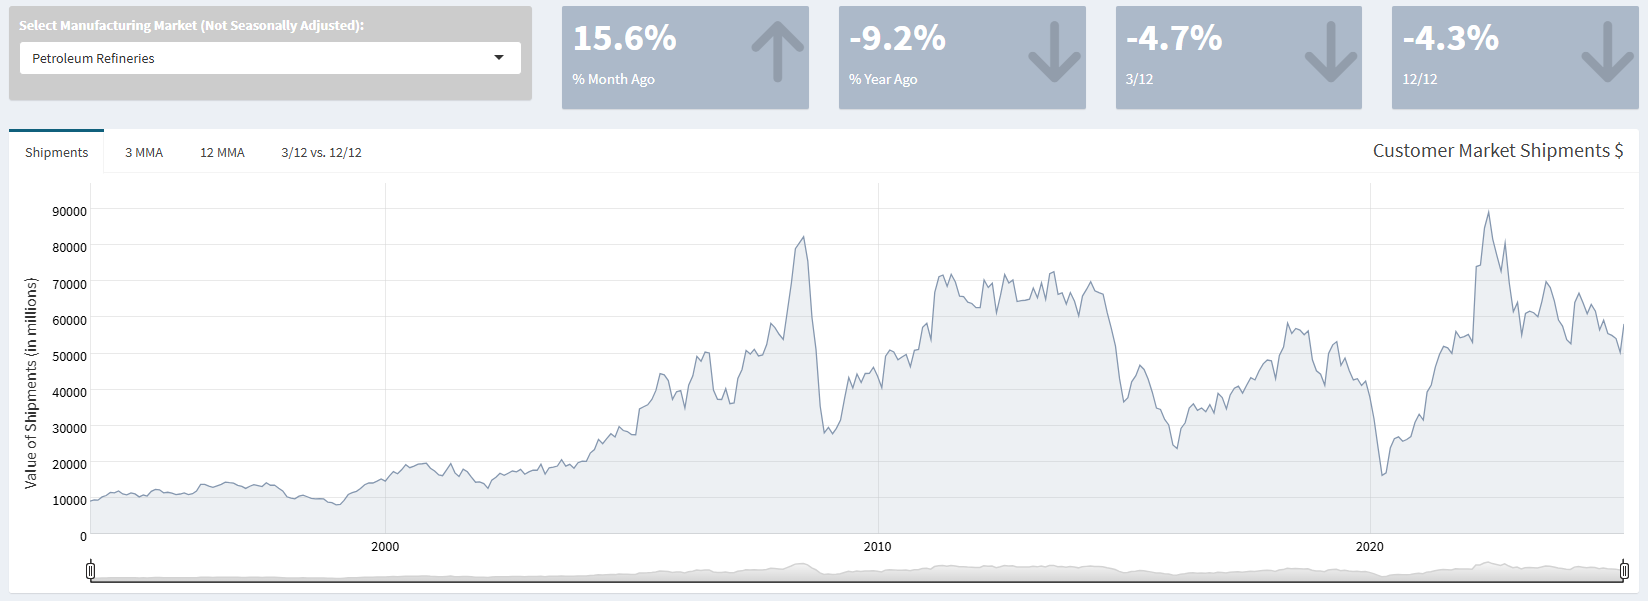
- Petroleum Refineries
- Petroleum Refinery shipments are up 15.6% in March compared to February but still -9.2% y/y compared to March 2024. Industrial production index for petroleum refineries was 88.53 in April, which was up 2.7% m/m and -1.8% y/y. When the 12 month moving average calculation is applied, the petroleum refineries industrial production index have visually been falling slightly throughout 2025.
The EMI report can be accessed at this link: https://www.nfpa.com/econ-market-indicators. An excel file with all the raw data is also available to download for internal analysis.
If you have any questions about interpreting or using the data in these reports, please contact Cecilia Bart at cbart@nfpa.com.