


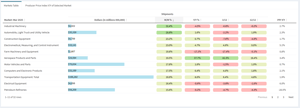
NFPA’s Econ and Market Indicators (EMI) report pulls together data from multiple sources to provide the latest trends for:
- Customer Markets (U.S. Census Bureau)
- Economic Indicators (U.S. Census Bureau)
- Industrial Production (Federal Reserve)
- Capacity Utilization (Federal Reserve)
- Producer Price Index (Bureau of Labor Statistics)
Members can view individual series and apply different calculations such as moving averages and rates of change. Members can also compare rates of change between markets. Tables can be sorted by values for quick looks at growing and declining markets.
Some highlights from the report include:
-
Industrial Machinery Shipments Experience a Major Increase
-
The non-seasonally adjusted shipments for Industrial Machinery Manufacturing reach 5,598 million dollars for the month of June. This is a major increase over the last month at 38.2%. This also represents a 33.3% increase in the value from last year.
-
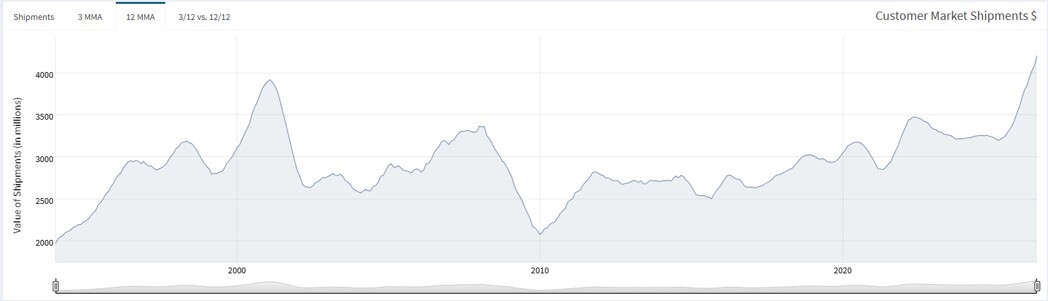
Industrial Machinery Manufacturing: 12MMA of Shipments, 1/1994 – 6/2026
-
Highest Purchasing Managers’ Index in Over Four Years
-
July’s Purchasing Managers’ Index (PMI) rose by 2.3 percentage points to 55.6. This is the highest reported value since May of 2022, signaling strength and growth in the manufacturing sector. It appears that this growth will be sustained as both Total Manufacturing Orders and Shipments increased in the past month. Orders went from 659,551 to 695,486 and Shipments went from 656,893 to 692,504 which are both a 5.4% M/M increase.
-
The EMI report can be accessed at this link: https://www.nfpa.com/econ-market-indicators. An excel file with all the raw data is also available to download for internal analysis.
If you have any questions about interpreting or using the data in these reports, please contact Richard Zarling at rzarling@nfpa.com.