

Recent updates to the NFPA’s U.S. Foreign Trade of Fluid Power report reveal that the total value of U.S. imports and exports for fluid power products have remained steady throughout late 2025 and early 2026, as shown by the 12-month moving average (12MMA). In April 2026, the 12MMA of the U.S. trade balance for these products was approximately -$288 million (Exports minus Imports). This is a 2% larger difference than the 12MMA in January 2026. The balance of trade for the past 12 months is -$4,028,926,445. The images below show the Total Fluid Power Imports and Exports since 2005 and then a zoomed in image from January 2023 to April 2026.
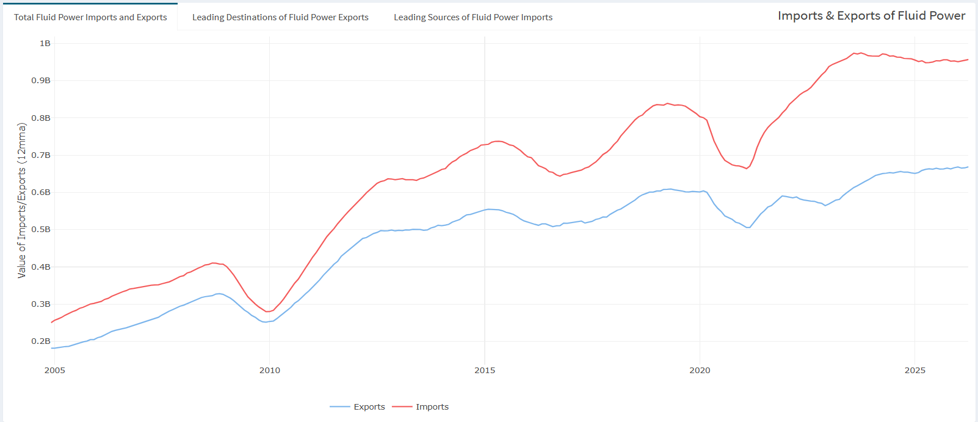
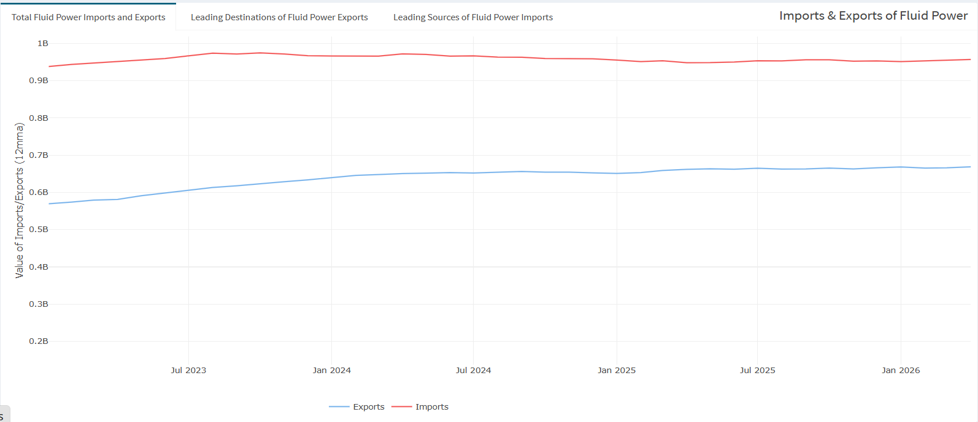
U.S. Imports and Exports of Fluid Power Products. This graph is from NFPA’s U.S. Foreign Trade of Fluid Power report.
Within the foreign trade report, we can see trade balances with various countries. The table below details the most significant balances over the last 12 months, positive and negative.
|
Positive Trade Balances (March 2025 – April 2026) |
Negative Trade Balances (March 2025 – Apr 2026) |
||
|
Country |
Exports - Imports |
Country |
Exports - Imports |
|
Brazil |
$454,001,475 |
Mexico |
-$2,040,250,905 |
|
Canada |
$447,650,596 |
Germany |
-$1,364,506,327 |
|
Australia/New Zealand |
$267,617,377 |
Japan |
-$1,262,938,225 |
This data and more can be found in NFPA’s International Fluid Power tab and Dashboard.
Access the Dashboard: https://www.nfpa.com/import-export-dashboard.
For questions, contact Richard Zarling at rzarling@nfpa.com or 414-259-2021.