

Understanding the Trends: Context Behind Fluid Power Charts
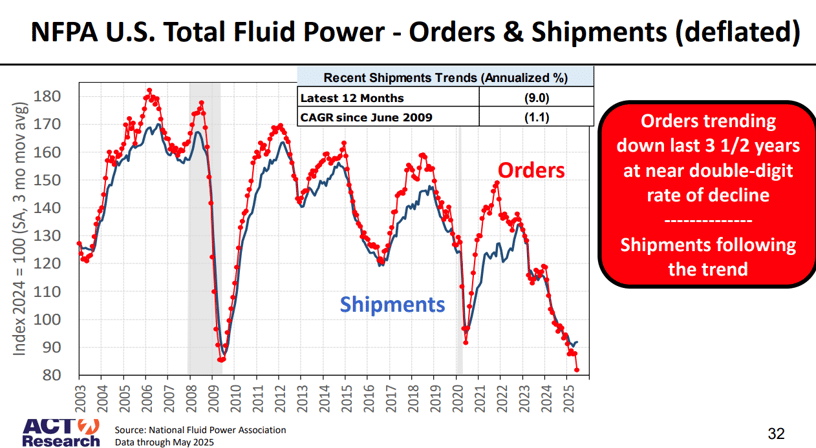
During Jim Meil’s recent presentation at the Industry and Economic Outlook Conference, several charts based on NFPA market data appeared to show a long-term downward trend for fluid power. While the data behind these visuals is accurate, interpreting the trend correctly is crucial. Questions arose as to whether the charts suggest that alternative technologies are displacing fluid power. However, that is not the likely explanation.
What the CSS Data Represents
The Confidential Shipment Statistics (CSS) program tracks shipments and orders for fluid power components produced in the United States. Importantly, this dataset does not include imports of fluid power products into the U.S. As a result, CSS figures represent only domestic production, not the entirety of the U.S. market.
This distinction is essential when interpreting trends. A decline in U.S. production does not necessarily mean a decline in demand for fluid power. It may reflect shifts in the source of supply rather than reductions in usage or market relevance.
The Broader Picture: Imports and Exports
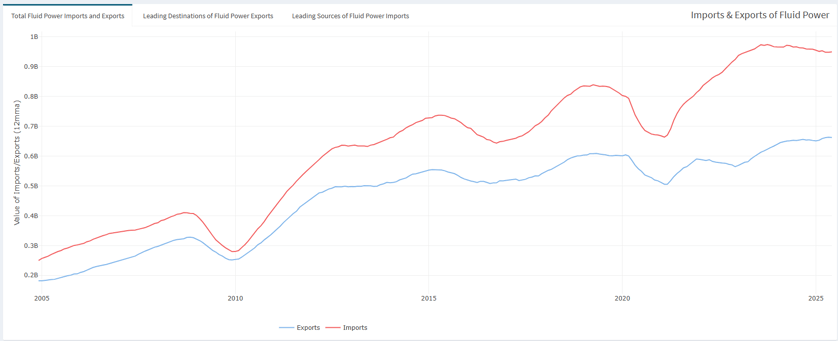
To get a more comprehensive view of the fluid power market, we must consider import and export dynamics. While trade data from the U.S. International Trade Commission is limited by the way products are defined, grouped, or categorized within their import and export reports, it nonetheless offers valuable insights.
Recent data shows a widening gap between imports and exports of fluid power products. Imports have grown faster than exports, suggesting that a portion of what was once U.S. produced is now being supplied by foreign manufacturers. This shift contributes significantly to the appearance of a long-term decline in CSS data.
This trend aligns with what many in the industry are already seeing: increased imports from countries like Mexico and various European nations, and a move by some U.S. based companies to shift production abroad.
Adjusting for Inflation
Adjusting for inflation also influences how market trends are perceived. Periods of elevated inflation can make recent growth appear modest or even negative once values are inflation-adjusted. Although such adjustments are essential, they can mask the true demand environment if not evaluated alongside trade figures.
Where to Find More Information
To help NFPA members understand these market forces, we provide a dashboard that incorporates import/export data from the U.S. International Trade Commission. This dashboard visually demonstrates:
-
The growing gap between red (imports) and blue (exports) lines over time.
-
Shifts in trade patterns, such as the flattening of fluid power imports from China and a sharp increase in imports from Mexico.
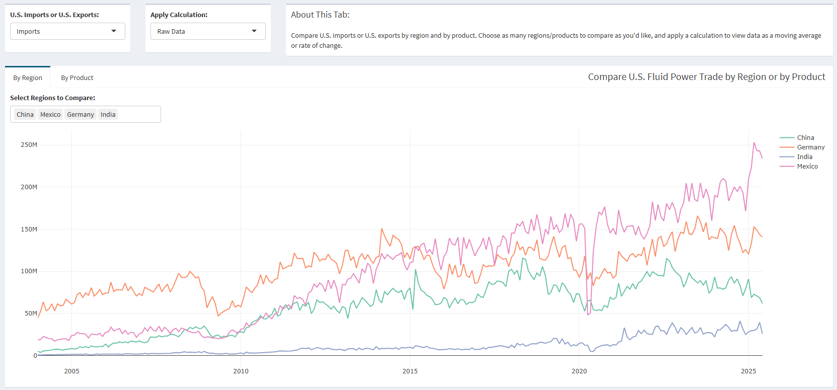
These tools are meant to supplement the CSS data and provide a more complete view of what’s happening in the market.
Access the Import-Export Dashboard here: https://www.nfpa.com/import-export-dashboard
Access the Stats Dashboard here: https://www.nfpa.com/statsdashboard
If you have any questions about interpreting or using the data in these reports, please contact Cecilia Bart at cbart@nfpa.com.